Provide a policy-based abnormal detection mechanism in crane-agent
5 分钟阅读
Summary
Crane-agent is responsible for detecting abnormality on nodes and interference between running pods.
Currently, such detection mechanism is fixed and quite simple.
Crane-agent compares the values of some pre-defined metrics, such as node’s cpu_total_usage and cpu_total_utilization,
with some thresholds periodically. If the metric value is higher the threshold for some times, say the cpu_total_utilization
on a node is found higher than 80% in 3 consecutive detections, crane-agent thinks the node entering into an abnormal status,
and will perform some further actions, such as suppressing or evicting pods with low priorities.
This proposal suggests a flexible and extensible way to detect abnormality. The criteria of abnormality can be customized by users in form of policies, and the detection process is executed in a policy decision-making way, which is offloaded to a general-purpose policy engine.
Motivation
The criteria of abnormality or interference are not that always as simple as something like a metric value is higher than a threshold. Different users may have different QOS requirements on different applications in different environments. The rule of abnormality detection varies, and it is impossible to implement all of them in code in advance.
Goals
- Provides an abnormality detection mechanism which can consume external metrics.
- Provides an abnormality detection mechanism in which the logic determining how to check the abnormality can be customized.
- Metrics and detection policies can be added, updated and deleted on the fly without changing the code.
Non-Goals
- How to handle the abnormality or interference. This proposal only focuses on detection, and the subsequent action is out of scope.
Proposal
User Stories
Story 1
A user has a critical online application which is latency sensitive running in the cluster, and he wants to use both the 99th percentile response time and the error code rate as the application QOS indicators. If either of these 2 indicators deteriorates, the application is thought of being in abnormal status.
Story 2
The SRE team finds that if the node CPU utilization is more than 60%, the QOS of some latency sensitive applications running on it are likely to decline. So they want to keep the node CPU utilization lower than 60%. If the utilization is higher than this threshold, the BE applications should be suppressed accordingly.
Story 3
The traffic of online applications is very low at night, and the offline jobs are run during this time. Comparing with online applications, offline jobs always require more CPU resource quantities but less resource qualities. In this case, the SRE team wants to set different node CPU load thresholds in the daytime and at night.
Functional Requirements
Implementation Details
API
#####NodeQOSEnsurancePolicy
apiVersion: ensurance.crane.io/v1alpha1
kind: NodeQOSEnsurancePolicy
metadata:
  name: "xxx"
spec:
  nodeQualityProbe:
    prometheus:
      targets: ['localhost:9090']
      queryInterval: 60s
      metrics:
        - name: node_cpu_utilization
          query: 1 - avg(irate(node_cpu_seconds_total{mode="idle", instance="$nodeName"}[5m]))
      variables:
        - name: nodeName
          valueFrom:
            fieldRef:
              fieldPath: spec.nodeName
  objectiveEnsurances:
    - name: "ext_cpu_total_distribute"
      avoidanceThreshold: 2
      restoreThreshold: 2
      actionName: "disablescheduling"
      policy: |
        default abnormal = false
        hour := time.clock([time.now_ns(), "Local"])[0]
        abnormal {
          input.node_cpu_utilization > 0.6
          hour >= 7, hour < 21
        }
        abnormal {
          input.node_cpu_utilization > 0.8
          hour >= 21
        }
        abnormal {
          input.node_cpu_utilization > 0.8
          hour < 7
        }
#####PodQOSEnsurancePolicy
apiVersion: ensurance.crane.io/v1alpha1
kind: PodQOSEnsurancePolicy
metadata:
  name: "xxx"
spec:
  selector:
    matchLabels:
      app: test
  qualityProbe:
    prometheus:
      targets: ['localhost:9090']
      queryInterval: 60s
      metrics:
        - name: test_app_p90_latency
          query: histogram_quantile(0.9, rate(http_request_duration_seconds_bucket{pod=~"$podName", node="$nodeName"}[1m]))
      variables:
        - name: podName
          valueFrom:
            fieldRef:
              fieldPath: metadata.name
        - name: nodeName
          valueFrom:
            fieldRef:
              fieldPath: spec.nodeName
  objectiveEnsurances:
    - name: "ext_cpu_total_distribute"
      avoidanceThreshold: 2
      restoreThreshold: 2
      actionName: "disablescheduling"
      policy: |
                abnormal if test_app_p90_latency[_].value > 0.1
In addition to Prometheus, other protocols, such as Graphite, InfluxDB can also
be added in the future.
Metrics
Built-in metrics
Currently, crane-agent collects a bunch of metrics(defined in pkg/ensurance/collector/types/types.go, e.g.
cpu_total_usage).
These metrics are collected by nodelocal and cadvisor collectors, both of which collects metrics every 10 seconds.
We call these metrics as built-in metrics. Users can use built-in metrics in the policy without explicit setting, and crane-agent will pass their values to every request to policy engine.
External metrics (New)
Crane-agent can also get external metrics by querying against prometheus servers. A new prometheus quality probe
will be added to CRDs PodQOSEnsurancePolicy and NodeQOSEnsurancePolicy as shown in above 2 example yamls.
In PodQOSEnsurancePolicy, .spec.nodeQualityProbe.prometheus.metrics.query is a promQL, which
may includes some node variables (prefixed with $). In this case, crane-agent will use its node name
to replace the variable $nodeName.
In PodQOSEnsurancePolicy, .spec.qualityProbe.prometheus.metrics.query is a promQL, which
may includes some pod related variables ($nodeName, $podName in this example). Crane-agent will firstly
get all pods that match the .spec.selector.matchLabels on its node. Say two pods are selected, and
their names are pod-1 and pod-2, and the node name is node-1. The replaced promQL will be
histogram_quantile(0.9, rate(http_request_duration_seconds_bucket{pod=~"pod-1|pod-2", node="node-1"}[1m]))
And 2 query results are expected to get returned, like:
test_app_p90_latency{pod="pod-1", ...} 0.01
test_app_p90_latency{pod="pod-2", ...} 0.01
Simply speaking, variables in promQL help crane-agent only query metrics of its own node and the pods that running on its own node.
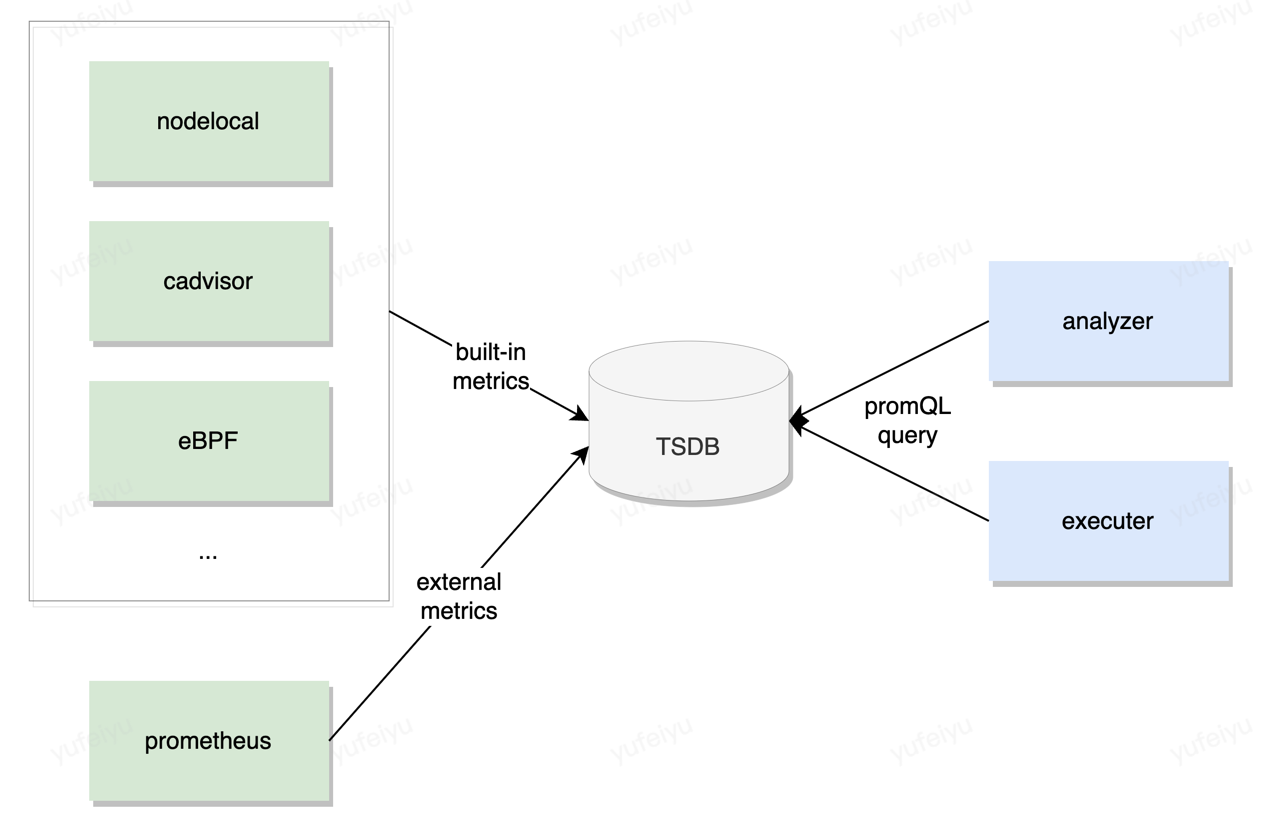
Embedded metrics TSDB
In order to decouple the components that collect metrics and those which consume the metrics, and to make these components’ logic simple, an embedded metrics TSDB will be imported into crane-agent.
Prometheus-tsdb and vmstorage are two good candidates, both of which are easy to insert values and are compatible with promQL query grammar.
Both analyzer and executor fetch metrics from the TSDB without considering where the metrics come from.
Policy
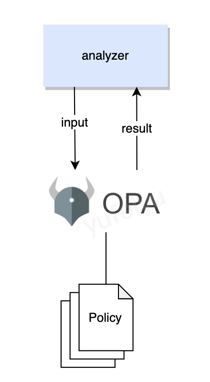
The Open Policy Agent (OPA) is an open source, general-purpose policy engine that unifies policy enforcement. Crane-agent will use it to evaluate if nodes or pods are abnormal.
The criteria for detecting abnormality is not pre-defined or hardcoded, instead, it is customized by users at runtime.
A policy filed will be added to ObjectiveEnsurance, which is
a rego rule whose result is a boolean
element.
crane-agent will feed both the latest built-in and external metrics as input into the OPA policy engine, and OPA make decisions based on input and policies.
A sample input is as follows:
{
  "crane": {
    "cpu_total_usage": 4680,
    ... orhter built-in mertrcs
  },
  "test_app_p90_latency": [
    {
      "labels": {
        "pod": "pod-1",
        "node": "node-1"
      },
      "value": 0.1
    },
    {
      "labels": {
        "pod": "pod-2",
        "node": "node-1"
      },
      "value": 0.09
    }
  ],
  ...
}