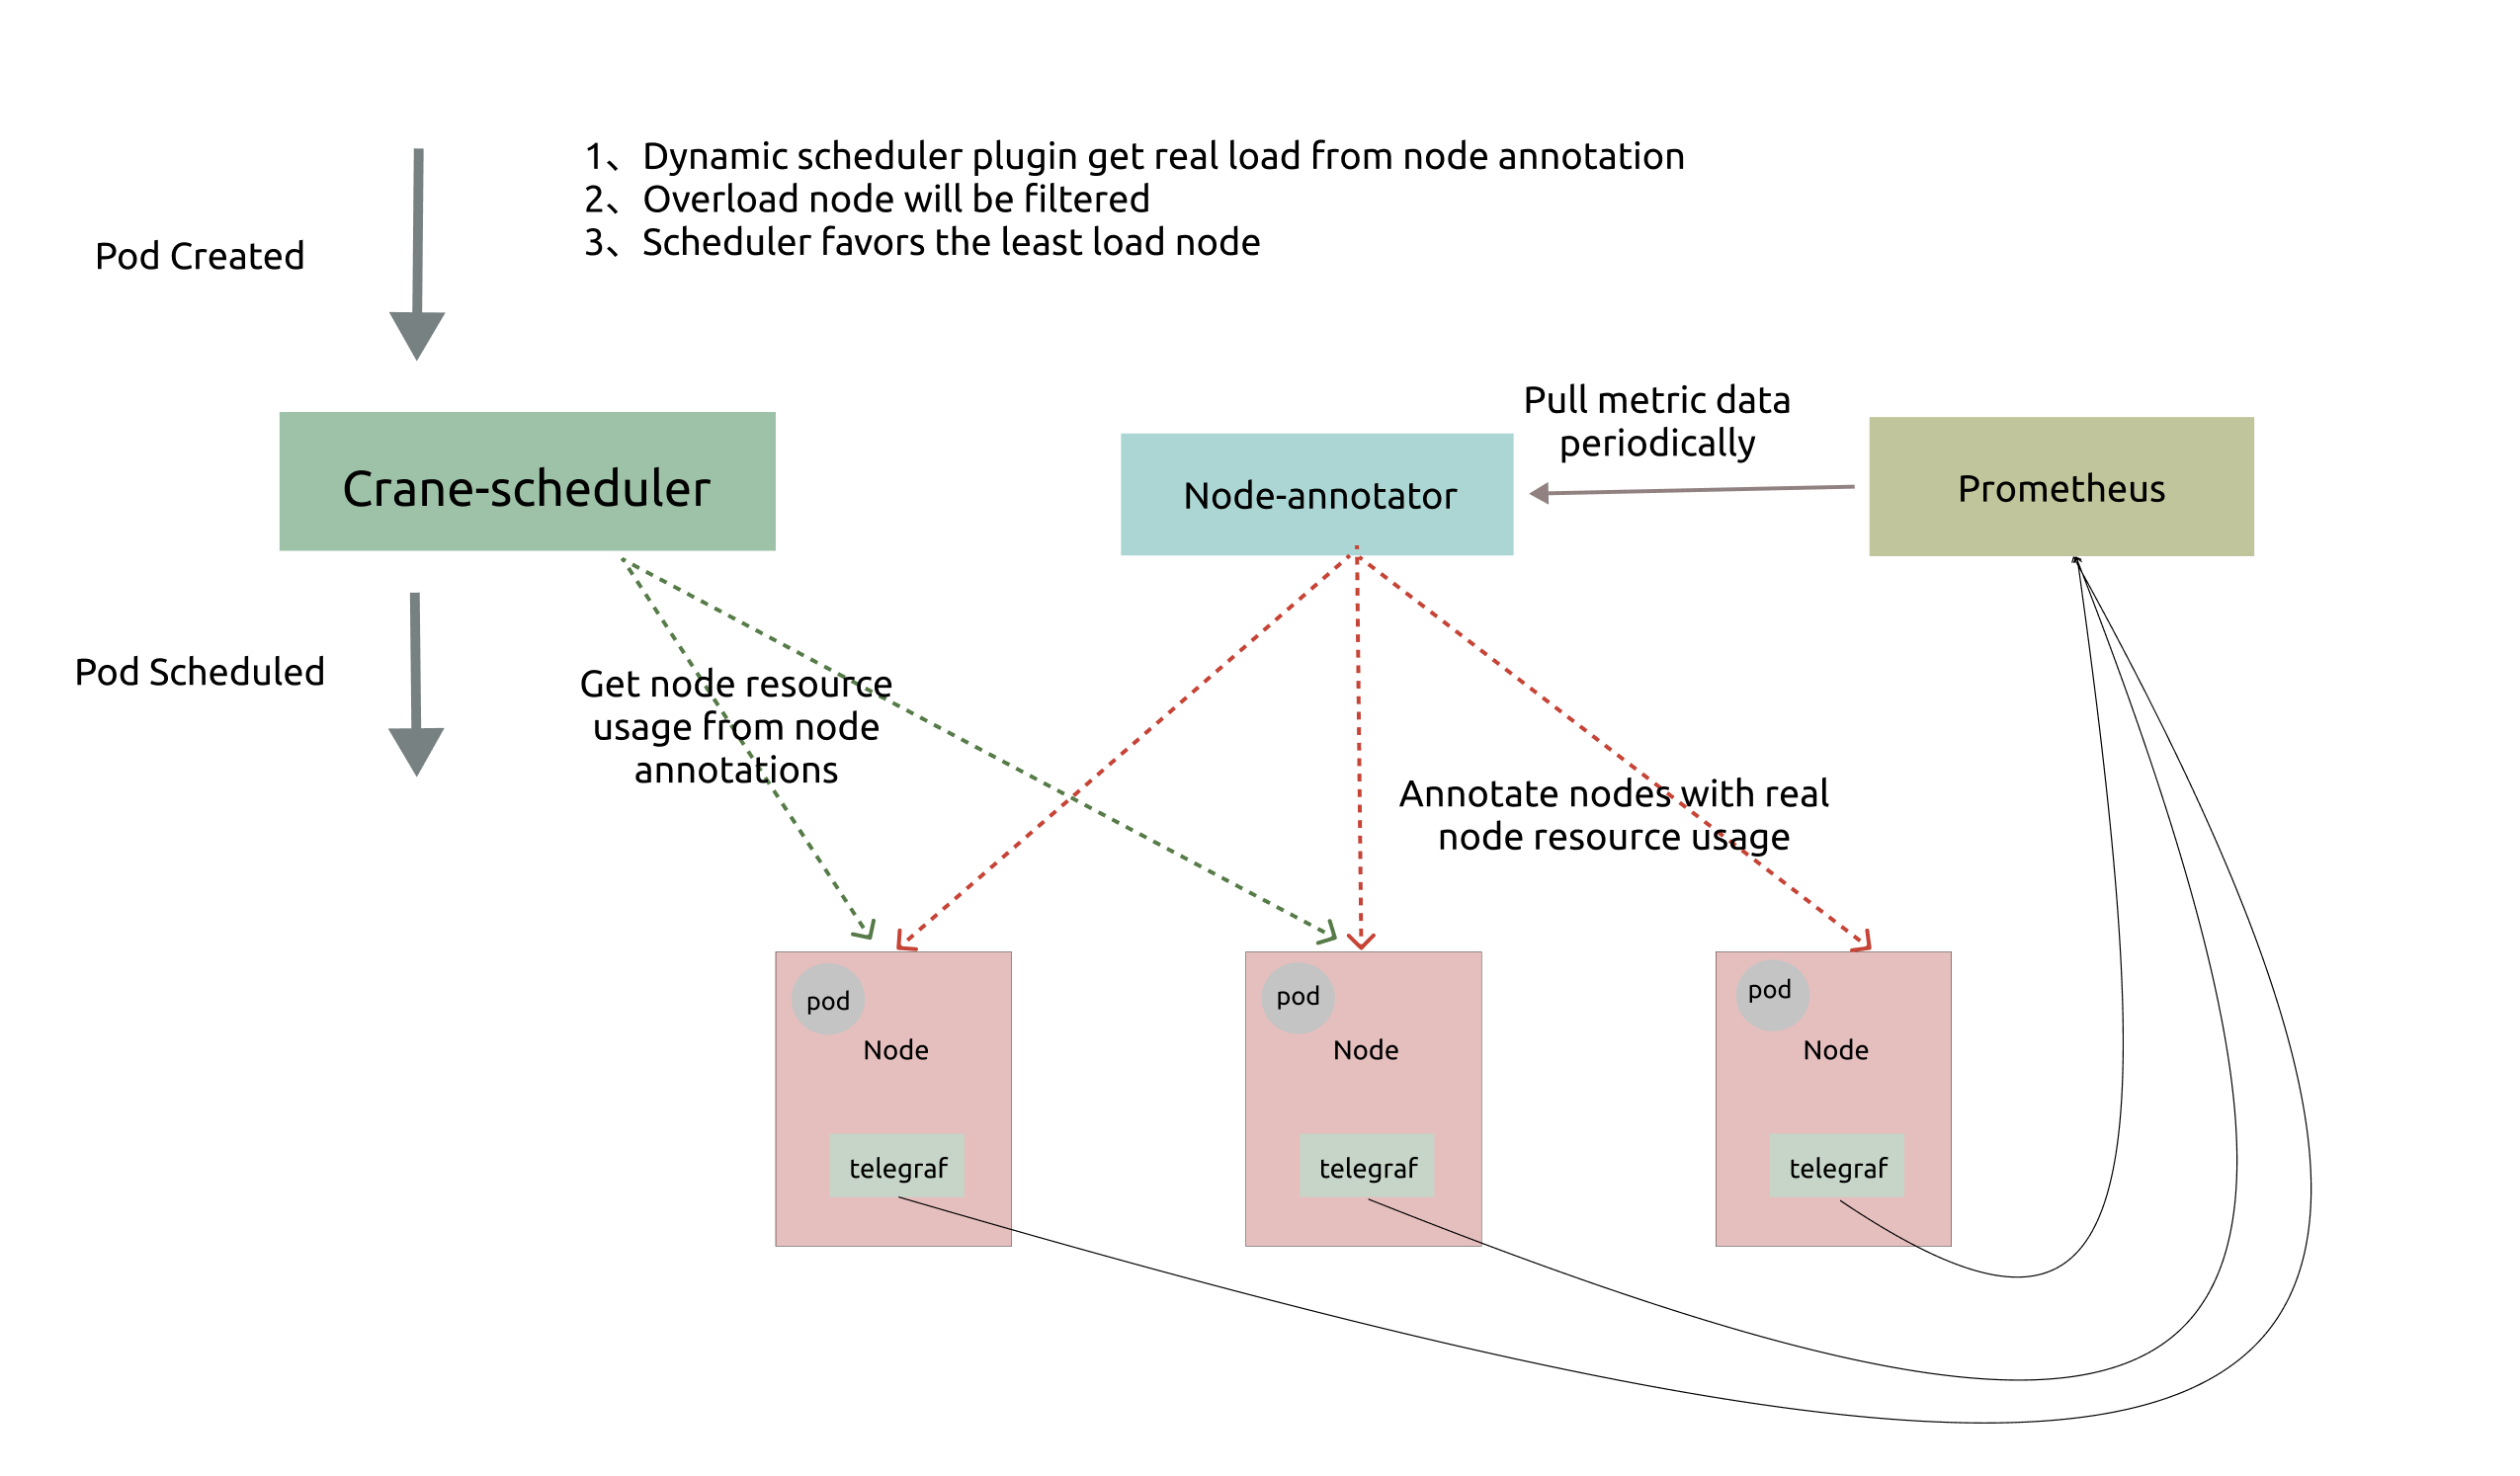
Dynamic-scheduler: a load-aware scheduler plugin
2 minute read
Native scheduler of kubernetes can only schedule pods by resource request, which can easily cause a series of load uneven problems:
- for some nodes, the actual load is not much different from the resource request, which will lead to a very high probability of stability problems.
- for others, the actual load is much smaller than the resource request, which will lead to a huge waste of resources.
To solve these problems, Dynamic scheduler builds a simple but efficient model based on actual node utilization data,and filters out those nodes with high load to balance the cluster.
Design Details
Architecture

As shown above, Dynamic scheduler relies on Prometheus and Node-exporter to collect and aggregate metrics data, and it consists of two components:
!!! note “Note”
Node-annotator is currently a module of Crane-scheduler-controller.
Node-annotatorperiodically pulls data from Prometheus and marks them with timestamp on the node in the form of annotations.Dynamic pluginreads the load data directly from the node’s annotation, filters and scores candidates based on a simple algorithm.
Scheduler Policy
Dynamic provides a default scheduler policy and supports user-defined policies. The default policy reies on following metrics:
cpu_usage_avg_5mcpu_usage_max_avg_1hcpu_usage_max_avg_1dmem_usage_avg_5mmem_usage_max_avg_1hmem_usage_max_avg_1d
At the scheduling Filter stage, the node will be filtered if the actual usage rate of this node is greater than the threshold of any of the above metrics. And at the Score stage, the final score is the weighted sum of these metrics’ values.
Hot Value
In the production cluster, scheduling hotspots may occur frequently because the load of the nodes can not increase immediately after the pod is created. Therefore, we define an extra metrics named Hot Value, which represents the scheduling frequency of the node in recent times. And the final priority of the node is the final score minus the Hot Value.