Installation
6 minute read
Prerequisites
- Kubernetes 1.18+
- Helm 3.1.0
Steps
Helm Installation
Please refer to Helm’s documentation for installation.
Installing prometheus and grafana with helm chart
Crane use prometheus to be the default metric provider.
Using following command to install prometheus components: prometheus-server, node-exporter, kube-state-metrics.
helm repo add prometheus-community https://prometheus-community.github.io/helm-charts
helm install prometheus -n crane-system --version 19.6.1 \
    --set pushgateway.enabled=false \
    --set alertmanager.enabled=false \
    --set server.persistentVolume.enabled=false \
    -f https://raw.githubusercontent.com/gocrane/helm-charts/main/integration/prometheus/override_values.yaml \
    --create-namespace  prometheus-community/prometheus
helm repo add prometheus-community https://finops-helm.pkg.coding.net/gocrane/prometheus-community
helm install prometheus -n crane-system --version 19.6.1 \
--set pushgateway.enabled=false \
--set alertmanager.enabled=false \
--set server.persistentVolume.enabled=false \
-f https://gitee.com/finops/helm-charts/raw/main/integration/prometheus/override_values.yaml \
--create-namespace prometheus-community/prometheusFadvisor use grafana to present cost estimates. Using following command to install a grafana.
helm install grafana \
    -f https://raw.githubusercontent.com/gocrane/helm-charts/main/integration/grafana/override_values.yaml \
    -n crane-system \
    --create-namespace https://github.com/grafana/helm-charts/releases/download/grafana-6.11.0/grafana-6.11.0.tgz
helm install grafana \
-f https://gitee.com/finops/helm-charts/raw/main/integration/grafana/override_values.yaml \
-n crane-system \
--create-namespace https://finops-generic.pkg.coding.net/gocrane/generic/grafana-6.11.0.tgz\?version\=latestDeploying Crane and Fadvisor
helm repo add crane https://gocrane.github.io/helm-charts
helm install crane -n crane-system --create-namespace crane/crane
helm install fadvisor -n crane-system --create-namespace crane/fadvisor
helm repo add crane https://finops-helm.pkg.coding.net/gocrane/gocrane
helm install crane -n crane-system --create-namespace crane/crane
helm install fadvisor -n crane-system --create-namespace crane/fadvisorCustomize the installation by overriding the Helm/Chart default parameters, for example:
helm install crane -n crane-system --set metricAdapter.enable=false --create-namespace crane/crane
| Parameters | Description | Default |
|---|---|---|
craned.containerArgs.prometheus-address | Craned Prometheus Address | http://prometheus-server.crane-system.svc.cluster.local:8080 |
metricAdapter.enable | Whether to install MetricAdapter | true |
metricAdapter.installApiService | Whether to install MetricAdapter ApiService | true |
craneAgent.enable | Whether to install Crane-Agent | true |
craneAgent.containerArgs.feature-gates | Crane-Agent feature-gates | NodeResource=false |
cranedDashboard.enable | Whether to install Crane-Dashboard | true |
For complete Helm/Chart parameters please refer to here
Using Existing Prometheus(Optional)
Normally in a production environment offen already have a specified Prometheus. You can modify the Crane Chart Release configuration by using the following command or modify the Craned Deployment container Args directly.
helm upgrade crane -n crane-system --set craned.containerArgs.prometheus-address=http://{prometheus-ip}:{port} --create-namespace crane/crane
At the same time, the cost analytics of the Crane Dashboard need to deploy kube-state-metrics (Prometheus Chart Will install it by default), also you need to config additional extraScrapeConfigs in your Prometheus, You can refer to here.
Finally, fadvisor needs to configure recording rules to aggregate cost data, You can refer to here to configuration in your Prometheus.
Using Existing Grafana(Optional)
The Crane Dashboard supports the Grafana report embedded with the Iframe to show the cost distribution. If you want to use an external Grafana to embed into the Crane Dashboard, you need to modify the nginx configuration in the configmap at first.
kubectl edit configmap -n crane-system nginx-conf
Change grafana.{{ .Release.Namespace }}.svc.cluster.local to be existing Grafana server address,Change http://$upstream_grafana:8082 to be the existing Grafana server port。
 location /grafana {
    set $upstream_grafana grafana.{{ .Release.Namespace }}.svc.cluster.local;
    proxy_connect_timeout       180;
    proxy_send_timeout          180;
    proxy_read_timeout          180;
    proxy_pass http://$upstream_grafana:8082;
    proxy_redirect off;
    rewrite /grafana/(.*) /$1 break;
    proxy_http_version 1.1;
    proxy_set_header  Host $http_host;
    proxy_set_header  Upgrade $http_upgrade;
    proxy_set_header  Connection $connection_upgrade;
    proxy_set_header  X-Real-IP  $remote_addr;
    proxy_set_header  X-Forwarded-For $proxy_add_x_forwarded_for;
}
Next up you need to config your grafana based on here, The idea was that Grafana supported embedding panels, but required that the corresponding permission configuration be turned on.
kubectl edit configmap -n monitor grafana
- Make sure Service configuration is the same as nginx
- Config datasources to be your prometheus address
- Config dashboardProviders
- Config dashboards
- Config grafana.ini
Finally, you should make sure your craned pods and grafana pods are restarted to reload configurations.
Deploying Crane-scheduler(optional)
helm install scheduler -n crane-system --create-namespace crane/scheduler
Verify Installation
Check deployments are all available by running:
kubectl get deploy -n crane-system
The output is similar to:
NAME                                             READY   STATUS    RESTARTS   AGE
crane-agent-8h7df                                1/1     Running   0          119m
crane-agent-8qf5n                                1/1     Running   0          119m
crane-agent-h9h5d                                1/1     Running   0          119m
craned-5c69c684d8-dxmhw                          2/2     Running   0          20m
grafana-7fddd867b4-kdxv2                         1/1     Running   0          41m
metric-adapter-94b6f75b-k8h7z                    1/1     Running   0          119m
prometheus-kube-state-metrics-6dbc9cd6c9-dfmkw   1/1     Running   0          45m
prometheus-node-exporter-bfv74                   1/1     Running   0          45m
prometheus-node-exporter-s6zps                   1/1     Running   0          45m
prometheus-node-exporter-x5rnm                   1/1     Running   0          45m
prometheus-server-5966b646fd-g9vxl               2/2     Running   0          45m
you can see this to learn more.
Customize Installation
Deploy Crane by apply YAML declaration.
git clone https://github.com/gocrane/crane.git
CRANE_LATEST_VERSION=$(curl -s https://api.github.com/repos/gocrane/crane/releases/latest | grep -oP '"tag_name": "\K(.*)(?=")')
git checkout $CRANE_LATEST_VERSION
kubectl apply -f deploy/manifests
kubectl apply -f deploy/craned
kubectl apply -f deploy/metric-adapter
git clone https://e.coding.net/finops/gocrane/crane.git
CRANE_LATEST_VERSION=$(curl -s https://api.github.com/repos/gocrane/crane/releases/latest | grep -oP '"tag_name": "\K(.*)(?=")')
git checkout $CRANE_LATEST_VERSION
kubectl apply -f deploy/manifests
kubectl apply -f deploy/craned
kubectl apply -f deploy/metric-adapterThe following command will configure prometheus http address for crane if you want to customize it. Specify CUSTOMIZE_PROMETHEUS if you have existing prometheus server.
export CUSTOMIZE_PROMETHEUS=
if [ $CUSTOMIZE_PROMETHEUS ]; then sed -i '' "s/PROMETHEUS_ADDRESS/${CUSTOMIZE_PROMETHEUS}/" deploy/craned/deployment.yaml ; fi
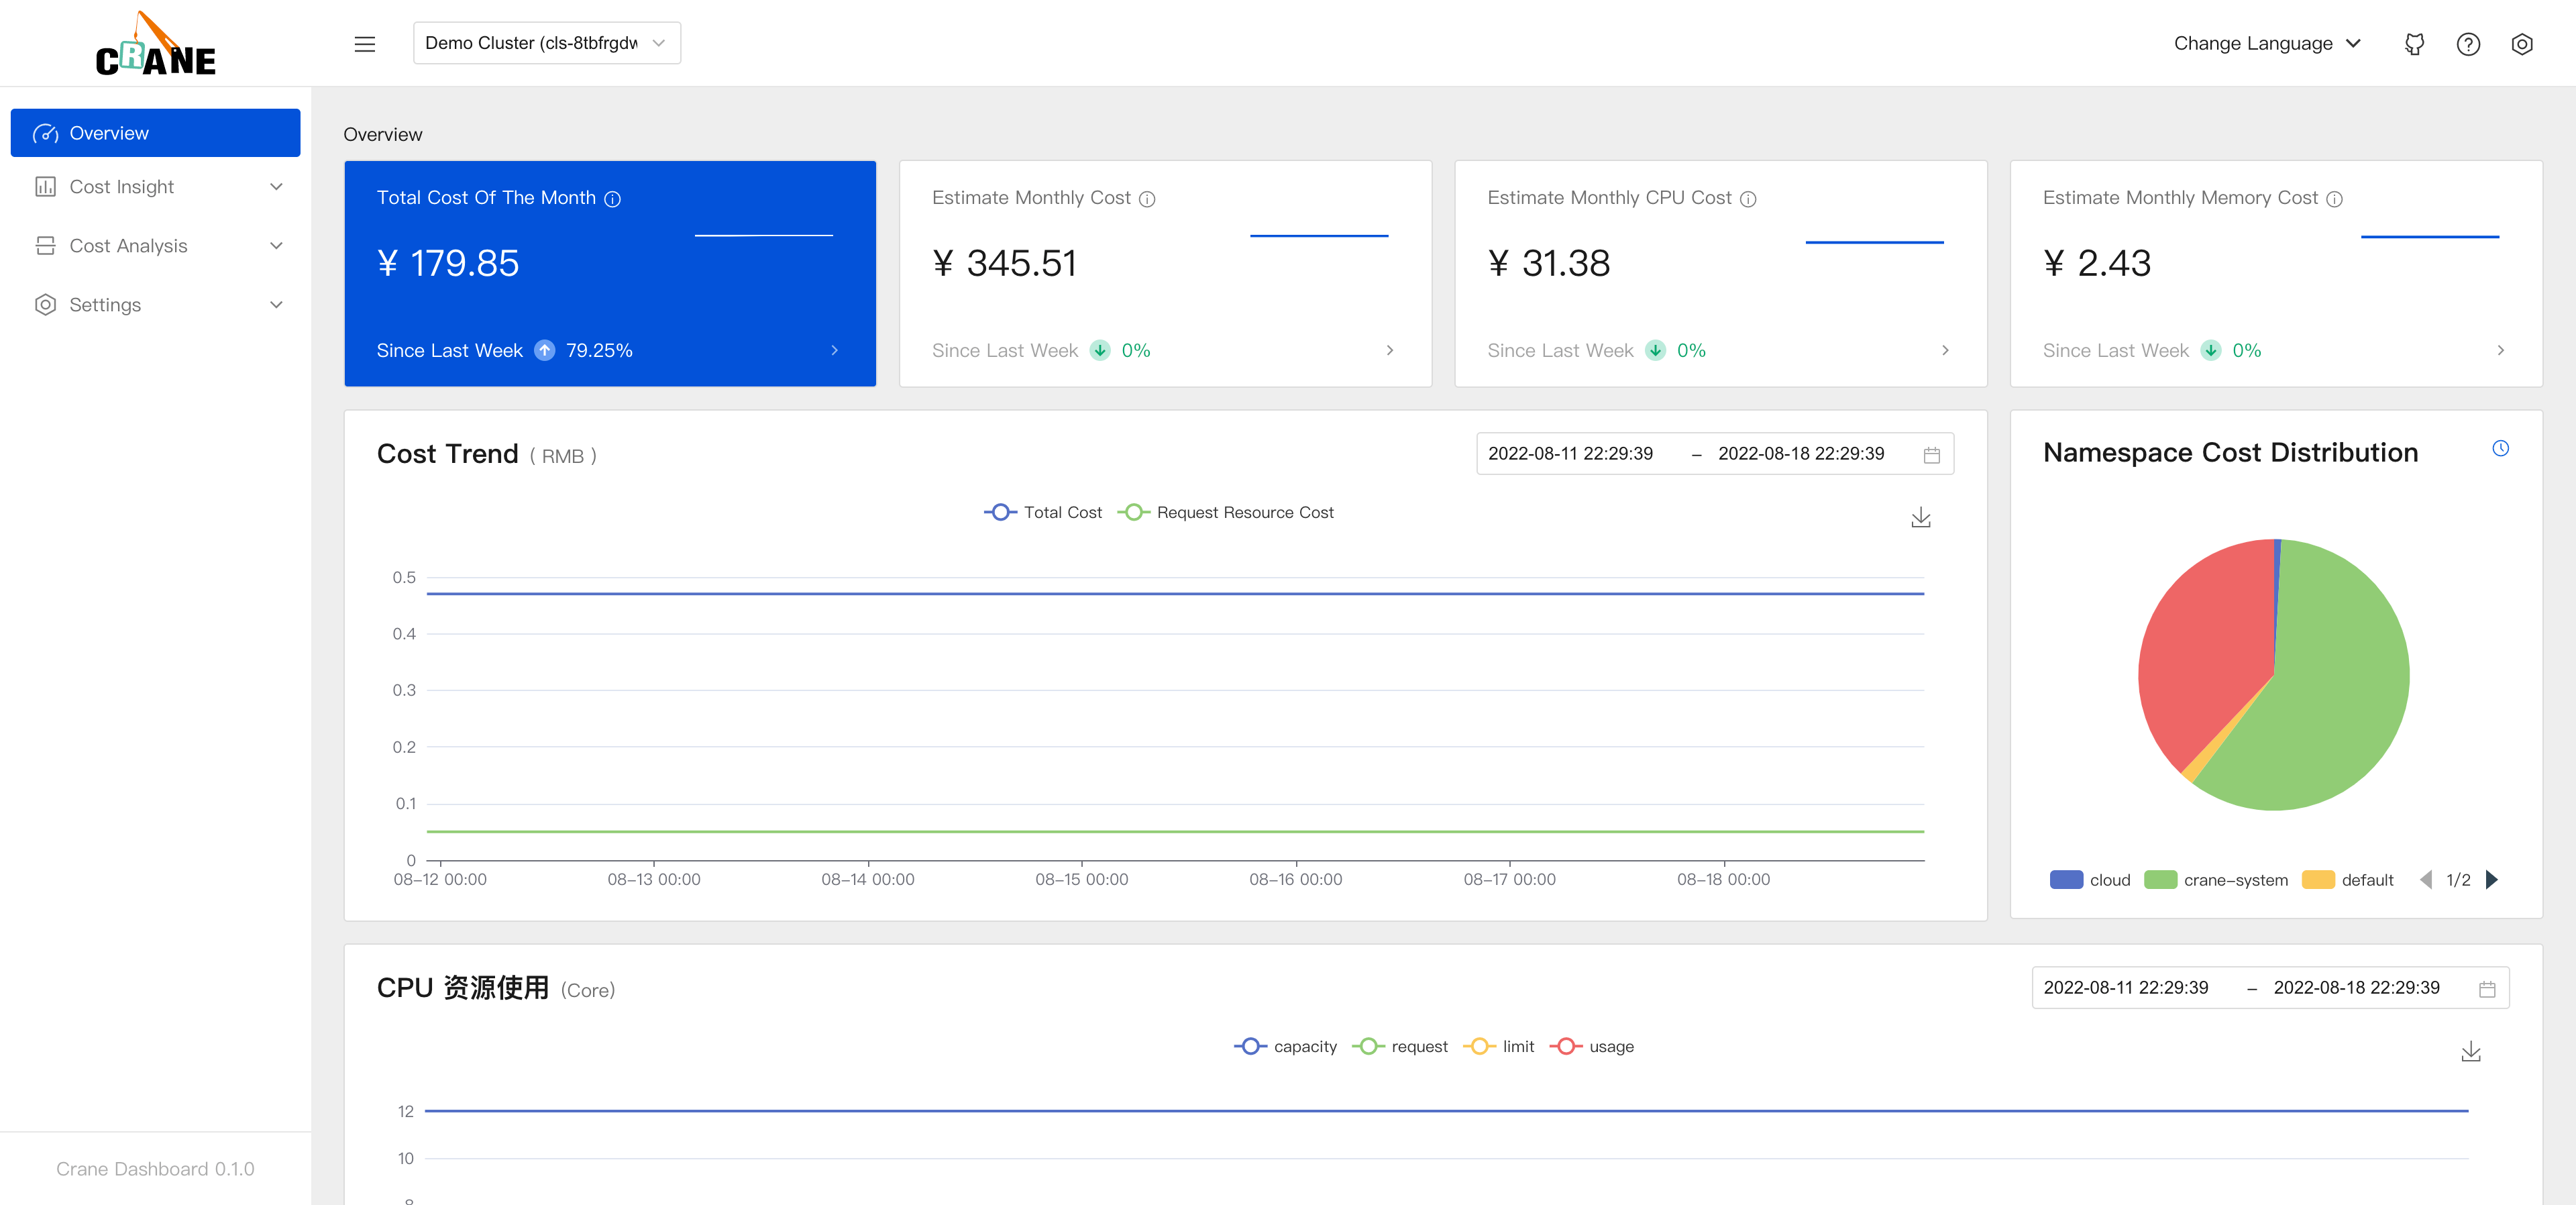
Access Dashboard
You can use the dashboard to view and manage crane manifests.
Port Forward
Easy access to the dashboard through kubectl port-forward.
kubectl -n crane-system port-forward service/craned 9090:9090
NodePort
# Change service type
kubectl patch svc craned -n crane-system -p '{"spec": {"type": "NodePort"}}'
# Get Dashboard link base on your cluster configuration
PORT=$(kubectl get svc -n crane-system craned -o jsonpath='{.spec.ports[?(@.name == "dashboard-service")].nodePort}')
NODE_IP=$(kubectl get node -ojsonpath='{.items[].status.addresses[?(@.type == "InternalIP")].address}')
echo "Dashboard link: http://${NODE_IP}:${PORT}"
LoadBalancer
Quick Start
# Change service type
kubectl patch svc craned -n crane-system -p '{"spec": {"type": "LoadBalancer"}}'
Example
$ kubectl patch svc craned -n crane-system -p '{"spec": {"type": "LoadBalancer"}}'

service/craned patched

$ kubectl get svc -n crane-system craned
NAME     TYPE           CLUSTER-IP      EXTERNAL-IP   PORT(S)                                                      AGE
craned   LoadBalancer   10.101.123.74   10.200.0.4    443:30908/TCP,8082:32426/TCP,9090:31331/TCP,8080:31072/TCP   57m

# Access dashboard via 10.200.0.4:9090
Ingress
kubernetes/ingress-nginx
If the cluster version is < 1.19, you can create the ingress resources like this:
apiVersion: networking.k8s.io/v1beta1
kind: Ingress
metadata:
  name: ingress-crane-dashboard
  namespace: crane-system
spec:
  ingressClassName: nginx
  rules:
  - host: dashboard.gocrane.io # change to your domain
    http:
      paths:
      - path: /
        backend:
          serviceName: craned
          servicePort: 9090
If the cluster uses Kubernetes version >= 1.19.x, then its suggested to create the second ingress resources, using yaml examples shown below.
These examples are in conformity with the networking.kubernetes.io/v1 api.
apiVersion: networking.k8s.io/v1
kind: Ingress
metadata:
  name: ingress-crane-dashboard
  namespace: crane-system
spec:
  rules:
  - host: dashboard.gocrane.io # change to your domain
    http:
      paths:
      - path: /
        pathType: Prefix
        backend:
          service:
            name: craned
            port:
              number: 9090
  ingressClassName: nginx
Example:
$ kubectl get svc -n ingress-nginx
NAME                                 TYPE           CLUSTER-IP       EXTERNAL-IP   PORT(S)                      AGE
ingress-nginx-controller             LoadBalancer   10.102.235.229   10.200.0.5    80:32568/TCP,443:30144/TCP   91m
ingress-nginx-controller-admission   ClusterIP      10.102.49.240    <none>        443/TCP                      91m

$ curl -H "Host: dashboard.gocrane.io" 10.200.0.5
<!DOCTYPE html>
<html lang="en">
  <head>
    <meta charset="UTF-8" />
    <meta name="viewport" content="width=device-width, initial-scale=1.0" />
    <title>Crane Dashboard</title>
    ................................................................
Traefik
apiVersion: traefik.containo.us/v1alpha1
kind: IngressRoute
metadata:
  name: dashboard-crane-ingress
  namespace: crane-system
spec:
  entryPoints:
    - web
  routes:
    - kind: Rule
      match: Host(`dashboard.gocrane.io`)
      services:
        - name: craned
          port: 9090
$ kubectl get svc -n traefik-v2
NAME      TYPE           CLUSTER-IP      EXTERNAL-IP   PORT(S)                      AGE
traefik   LoadBalancer   10.107.109.44   10.200.0.6    80:30102/TCP,443:30139/TCP   16m

$ curl -H "Host: dashboard.gocrane.io" 10.200.0.6
<!DOCTYPE html>
<html lang="en">
  <head>
    <meta charset="UTF-8" />
    <meta name="viewport" content="width=device-width, initial-scale=1.0" />
    <title>Crane Dashboard</title>
    ................................................................
Get your Kubernetes Cost Report
Get the Grafana URL to visit by running these commands in the same shell:
export POD_NAME=$(kubectl get pods --namespace crane-system -l "app.kubernetes.io/name=grafana,app.kubernetes.io/instance=grafana" -o jsonpath="{.items[0].metadata.name}")
kubectl --namespace crane-system port-forward $POD_NAME 3000
visit Cost Report here with account(admin:admin).